
Infographic: VN-Index up 0.77% on October 23
Viet Nam’s benchmark VN-Index rose by 0.77% to 1,774.15 points on October 23.
#VN-Index
Viet Nam’s benchmark VN-Index rose by 0.77% to 1,774.15 points on October 23.

Viet Nam’s stock market was dominated by gains in the October 21 trading session. VN-Index increased by 2.76% to 1,738.67 points on October 21.

Viet Nam’s benchmark VN-Index increase by 0.13% to 1,691.97 points on October 20.

Viet Nam’s benchmark VN-Index rose by 0.45% to 1,705.91 points on October 16.

Viet Nam’s benchmark VN-Index fell by 0.38% to 1,698.35 points on October 15.

Viet Nam’s benchmark VN-Index fell by 0.85% to 1,704.87 points on October 14.

Viet Nam’s benchmark VN-Index fell by 0.09% to 1,719.42 points on October 13.

Viet Nam’s stock market remained under downward pressure on October 12, with the VN-Index falling 14.11 points, or 0.81%, to 1,720.98 points.

Viet Nam’s benchmark VN-Index fell 0.22% to 1,735.09 on October 9.

Selling pressure spread across the Viet Nam stock market during the October 7 trading session. At the close, the VN-Index fell 5.69 points, or 0.32%, to 1,753.39 points.
![[Infographic] VN-Index rises 0.34% on October 6](https://en-cdn.nhandan.vn/images/zciPIeCFGcqPfhuTXakqmfYj9y7IPLov_E7spFIit1PbIYfIR5j4r-0G0hr3mCfJsh8gdWhDkFzX4j8Fa1UShw/chung610-8460.jpg.avif)
The VN-Index gained 5.88 points, or 0.34%, to close at 1,759.08 points in the October 6 trading session.

Viet Nam’s benchmark VN-Index rose by 0.89% to 1,753.20 points on October 5.

Viet Nam’s benchmark VN-Index fell by 0.66% to 1,749.30 points on October 2.
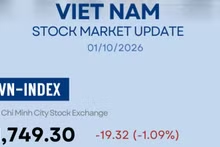
Viet Nam's stock market had a lacklustre session on October 1, with property and banking stocks coming under selling pressure. The VN-Index fell 19.32 points to close at 1,749.3.

Viet Nam’s benchmark VN-Index fell by 0.51% to 1,768.62 points on September 30.

Viet Nam’s benchmark VN-Index fell by 0.17% to 1,777.73 points on September 29.

Viet Nam’s benchmark VN-Index rose by 0.56% to 1,785.11 points on September 25.

Viet Nam’s benchmark VN-Index fell by 1.47% to 1,775.09 points on September 24.

Viet Nam’s benchmark VN-Index fell by 0.84% to 1,801.65 points on September 23.

Viet Nam’s benchmark VN-Index rose by 0.96% to 1,816.93 points on September 22.